Grow Room Dehumidifiers
Capacity and Settings
This grower installed a dehumidifier system and wasn’t sure that the dehumidifier had enough capacity. The grower also had questions about the best setting for the room %RH control.
We set up a basic data logging system with temperature and %RH sensors to gather information that would answer those questions. The logger recorded room (ambient) temperature and %RH every 5 minutes.
The data is true as recorded and the trends shown here are valid as they occurred in the room. The 3 graphs below show overviews of the complete monitoring period.


The Data Record
The grower tried a few different %RH settings on the dehumidifier controller. We are going to pull out 3 %RH settings (with 2 to 3 days’ operation at each setting) and examine the actual room conditions as they were at each setting.
Keep in mind that practical data logger systems like this are never as precise as everyone would like. Conditions inside rooms vary slightly from location to location, so there’s always a bit of a judgment call on where sensors should be placed. In addition, different sensors have different response times to changes in the room. This means that temperature and %RH fluctuations, both high and low, may not exactly track each other minute-by-minute.
All of the following graphs are similar in format. After we go over the first one thoroughly, the others will be easy to understand. They look complicated, but once you spend a few minutes studying them, they should become clear. Remember that the point of gathering this information is to help you grow healthier, higher yielding plants. It’s critical that you learn to optimize temperature and humidity if you want high performance growth.

On this 64%RH graph, the days track from left to right (6/12 is on the left, 6/15 is to the right). The room temperature is shown in Orange. The horizontal Orange line shows what the average nighttime temperature is. The humidity is shown in Blue, with the average nighttime %RH the horizontal Blue line. Red is vapor-pressure-deficit; we’ll discuss that one after we go through all the graphs.
The nighttime readings fluctuate so much because that’s when the dehumidifier is operating. The dehumidifier takes in humid air, removes moisture from it, and then expels the now-dry air at a slightly warmer temperature than it was when it went into the dehumidifier. This raises the temperature in the room. You probably already know that as a room heats up, the %RH will naturally drop even if no moisture is removed from the air. Because the dehumidifier is operating, then, there will naturally be temperature swings; the combination of temperature change and moisture removal results in the %RH swings.
If you look at the graph, you’ll see areas where Orange temperature lines angle fairly steadily upward. These are the “lights-on” times. The areas with sudden drops and rises show when the lights are switching on or off. The Blue %RH lines track similarly, but tend to go in the opposite direction vs. the temperature lines.
This is called the 64%RH graph, because the average nighttime humidity is very close to 64%. The average nighttime temperature is near 61°F. The daytime temperature is usually between 75 and 80°F. This means that there’s a fluctuation of about 16°F day to night. Most growers would say that this growroom is a little too humid and a little too cool at night. They might add that the 16°F drop is more than the recommended 10°F day to night drop. VPD shows this too (more on VPD later).

This 57%RH graph gives us some slightly different numbers to work with. The average nighttime temperature is 63°F; daytime temperature is 75 to 80°F. There is about a 14°F day to night drop. The graph shows a 57%RH nighttime average.

This 50%RH graph shows the average nighttime temperature at 71°F, with daytime 77 to 82°F; this gives us around an 8°F day/night difference. The 50%RH nighttime reading shows a much smaller RH-drop to the daytime reading. This is because the room is already quite dry, since the dehumidifier has run so much during the night. The frequent dehumidifier operation (to maintain 50%RH) is also likely responsible for the high nighttime temperature.
Answering the questions:
1) Is There Enough Capacity?
Most likely, yes. This system showed it could reliably hold 50%RH in this grow room. The dehumidifier was switching on and off as needed, which shows it has at least some remaining capacity to remove even more moisture.
2) What’s the Best Setting?
Much of that depends on the growth stage of the plants in the room. Vegetative growth can both handle, and probably requires, more humidity. The flowering stage is trickier. You should never have nighttime condensation (water droplets on a cool plant). But it’s also true that you shouldn’t stress the plants by having daytime conditions that are too dry, either.
This is where it becomes critical to understand moisture management, airflow, and equipment controls setup.
The 57%RH setting, for this grow room, is getting close to a good balance of temperature and humidity: Nights are cool enough to give the plants a rest and %RH is kept at about 55% to reduce the chance of spore establishment.
A 53 or 54%RH setting is a good option here for the vegetative stage. Any lower, and this room will need some nighttime cooling. Dropping the %RH even more for the flowering stage, will require the grower provide cooling to get proper nighttime temperatures.
Moisture- Going to the Next Level
As we discuss some of these moisture related complications, we are drawn back to the VPD concept mentioned earlier. We’ll also need to touch on the concept of “dew point”.
VPD
VPD, vapor pressure deficit, is a powerful concept used by professional greenhouse growers. It was developed to express how a plant “feels” the moisture in the air. VPD measures the pressure of the water vapor in the air (usually in kilo-Pascals, kPa). A complete explanation would take a full article in itself, but the short version is that experts generally agree that most plants will grow at least somewhat between 0.4 and 1.25 kPa VPD.
Dew Point
Dew point tells us, indirectly, how much moisture is in the air (via the ambient temperature at which it condenses out onto cool surfaces). When the air in a room carries the moisture for a 55°F dew point, for example, water droplets will form on the surface of anything with a surface temperature of 55°F or less.

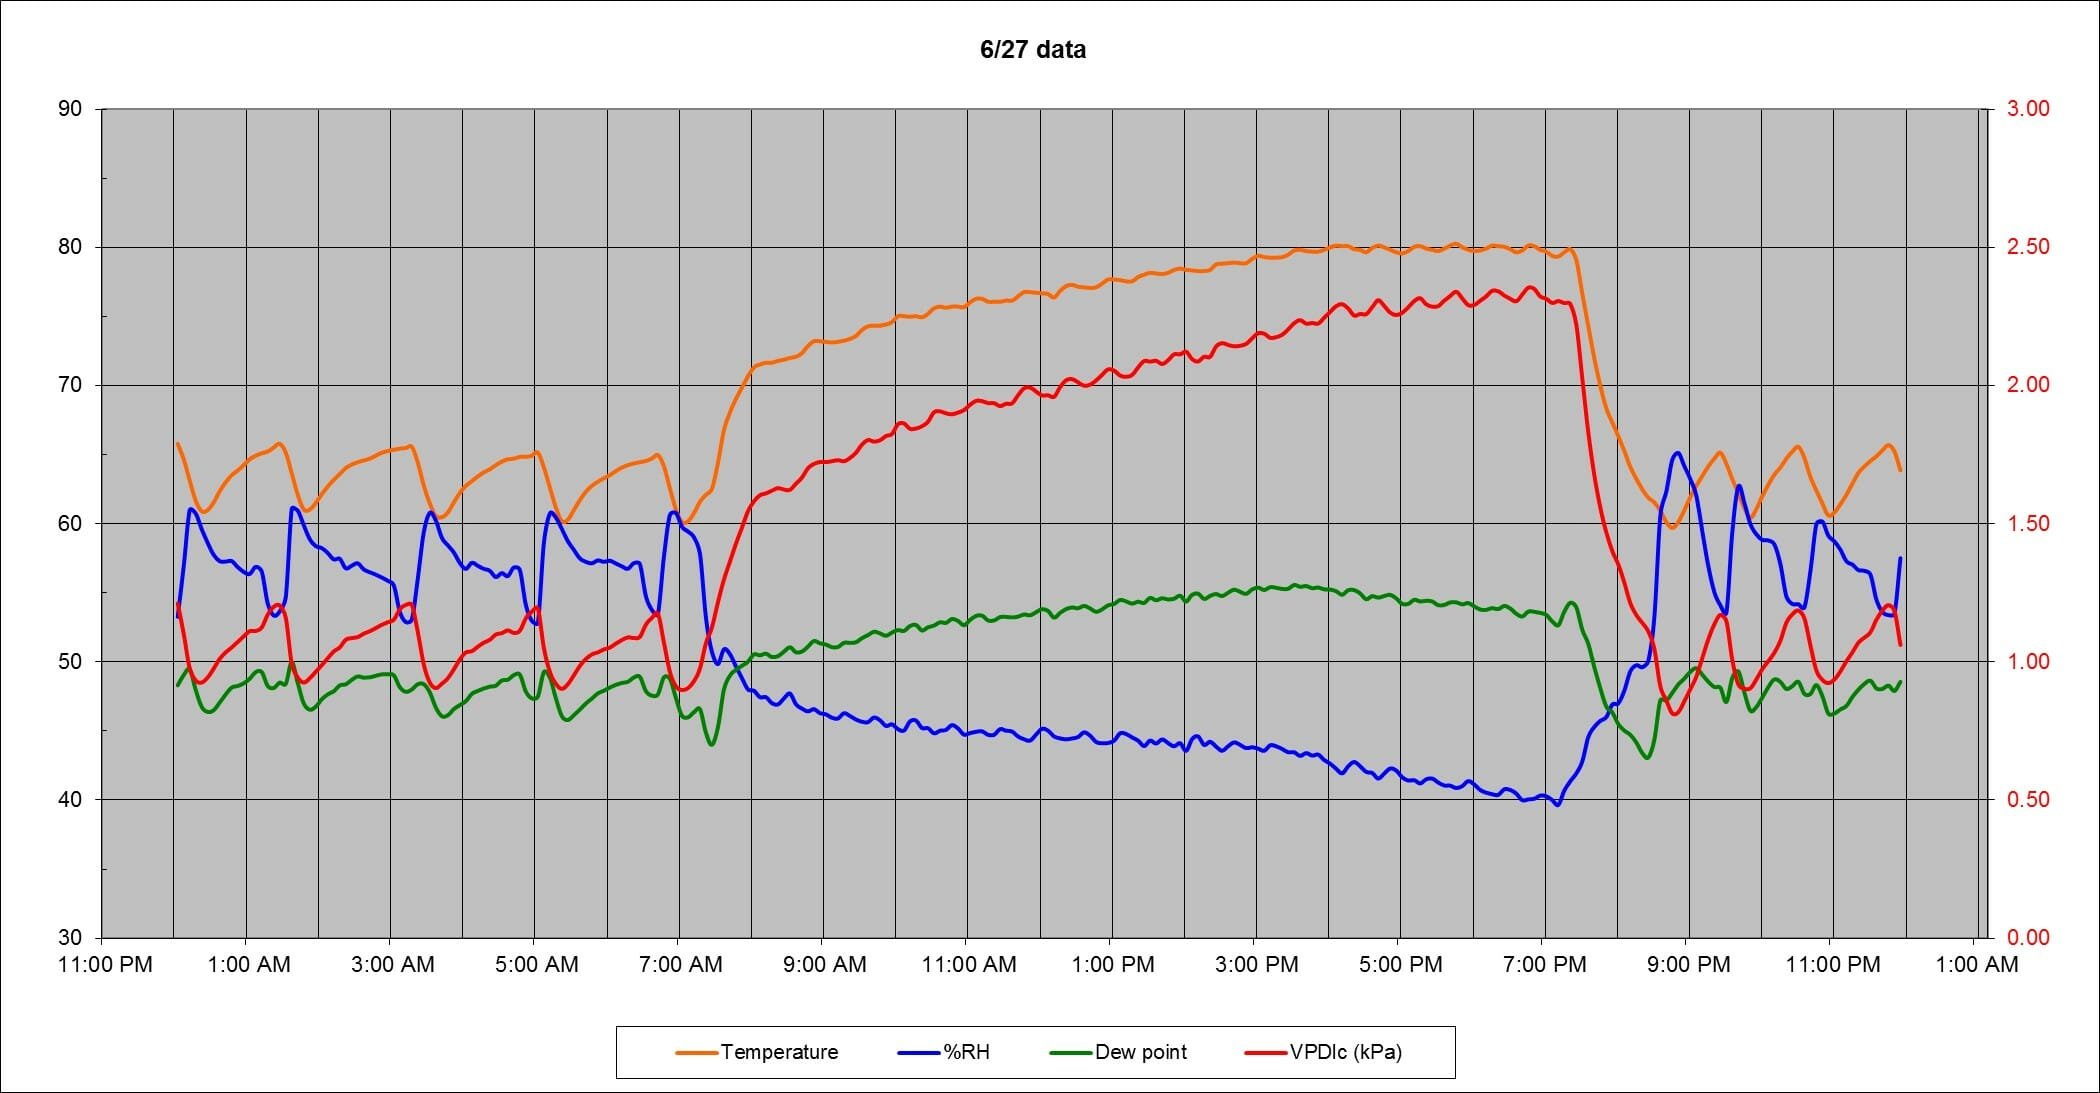
Look at the graph above, labeled “6/27 data”. See the Red VPD line? It corresponds to the red number scale on the right side of the graph. Nighttime VPD is approximately 1.0, which is okay on the VPD range of values. During the day, VPD climbs up (getting drier), and out of the proper VPD range; it spends the whole day between 2 and 2.5 kPa. The reason the VPD is climbing is because as the leaf temperature goes up, the leaves want the air to carry more water vapor. In other words, if the ambient water vapor pressure does not increase to compensate for the higher temperature, the VPD goes up. Increased water vapor in the air allows the plant to “feel” comfortable at higher temperatures.
Now, look at the Green dew point line. You’ll notice that it rises very little during the lights-on period. This shows how little the air moisture level increases from nighttime to daytime; there should be more water in the air during the day. Of course, this additional water should ideally be removed just before the day to night temperature drop. In turn, the nighttime %RH must also be held to the desired setting.
Make Your Own Graphs
All these graphs come from the original temperature and %RH measurements. Everything else can be calculated. The equations are a bit involved, but if you set up a spreadsheet, it can be simple to generate very useful performance graphs to show the performance of your dehumidifiers.
Contact QuestHydro for a set of spreadsheet-formatted equations.
Published on Sep 02 2015
Last Updated on Jun 05 2026
Categories: Press Release
Tags: FAQ, grow room dehumidifier questions and concerns, vapor pressure deficit